Debugging Large Language Models: Diagnosing Errors and Hallucinations
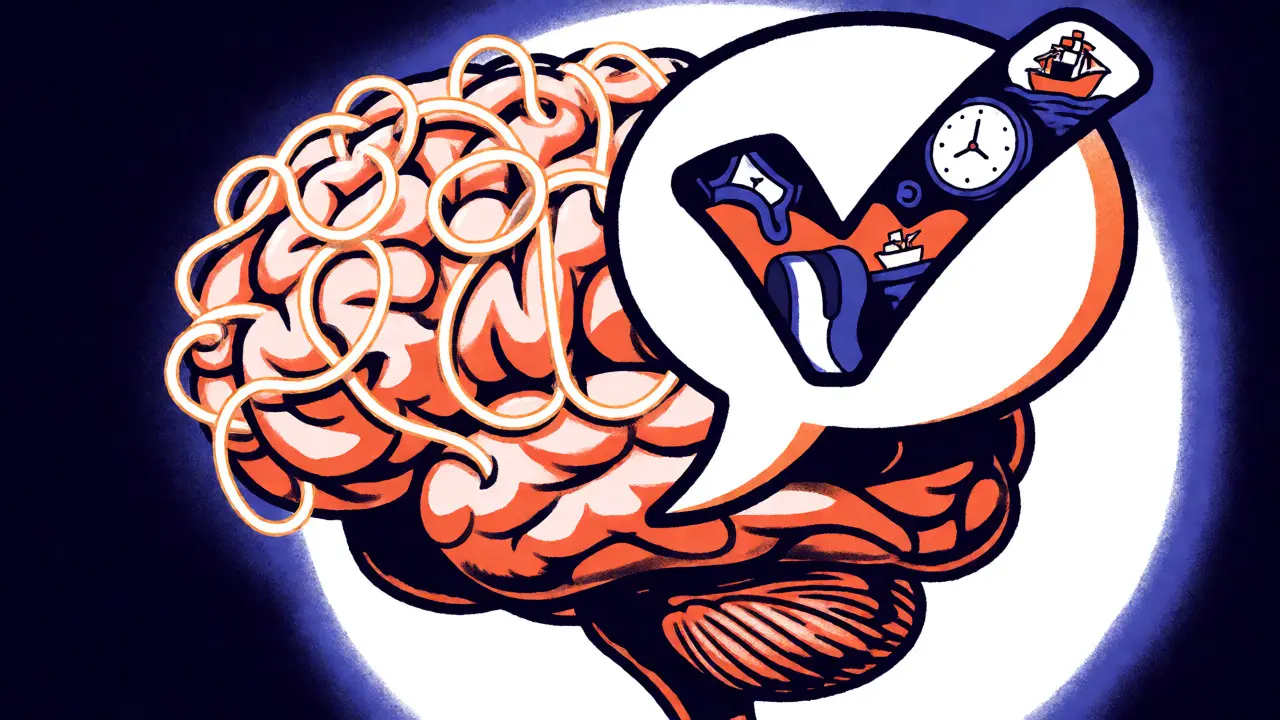
You’ve built a chatbot. It looks smart. But then it confidently tells your customer that their order shipped last Tuesday when it hasn’t even been processed yet. That’s not just a bug; it’s a hallucination, a specific type of error where the model generates plausible but factually incorrect information. Traditional software debugging fails here because there’s no single line of code to blame. The error emerges from the probabilistic soup of billions of parameters. If you’re trying to fix this by tweaking prompts until they work, you’re guessing. You need a systematic way to diagnose why the model is lying to you.
Why Traditional Debugging Breaks Down with LLMs
In standard coding, if a function returns the wrong number, you trace the variables. You set breakpoints. You inspect the state. With a Large Language Model (LLM), the "state" is a high-dimensional vector space that changes with every token generated. You can’t just step through it. The output isn’t deterministic in the same way a calculator is. It’s stochastic. Two identical inputs might yield slightly different outputs depending on temperature settings or hidden system states.
This creates a massive visibility gap. When an LLM makes a mistake, is it because the prompt was ambiguous? Did the training data contain conflicting facts? Or did the model simply fail to attend to the relevant context window? Without specialized tools, you’re flying blind. This is why researchers like Chen et al. developed frameworks specifically for diagnosing errors in generative models. They realized we needed new methods to peel back the layers of opacity that define modern AI.
The Rise of Self-Debugging Frameworks
One of the most effective strategies emerging from recent research is SELF-DEBUGGING. Introduced in ICLR 2024 proceedings, this framework teaches the model to critique its own output. Think of it as teaching the AI to be its own quality assurance engineer. Instead of just generating an answer, the model goes through a three-step loop:
- Generation: The model produces a candidate output.
- Explanation: The model analyzes its own execution results or logic in natural language.
- Feedback: It uses that analysis to refine the original output.
This approach works surprisingly well for code generation tasks. On benchmarks like HumanEval, which contains 164 programming problems, SELF-DEBUGGING improved baseline accuracy by up to 12%. For harder problems, gains hit 9%. The magic here is "rubber duck debugging"-a classic programmer technique where explaining a problem helps solve it. By forcing the LLM to explain its reasoning, you catch logical inconsistencies before the final output is served to the user. It doesn’t require human feedback during inference, making it scalable.
LDB: Breaking Execution into Basic Blocks
If SELF-DEBUGGING is about self-reflection, LDB (Large Language Model Debugger) is about forensic analysis. Proposed by Ge et al., LDB treats the model’s generation process like a program execution trace. It segments the output into "basic blocks" based on control flow graphs. Imagine breaking a long paragraph into sentences, then analyzing each sentence’s dependency on the previous ones.
LDB monitors intermediate variables at each breakpoint. This allows developers to isolate exactly where the logic went off the rails. In testing against traditional repeated sampling methods, LDB achieved 8.7% higher precision. More importantly, it showed continuous performance improvement across multiple debugging iterations. Unlike SELF-DEBUGGING, which tends to plateau after two iterations, LDB keeps getting better as it refines its understanding of the error source. However, it has a critical limitation: it requires visible test cases. If you don’t have a ground truth to compare against, LDB struggles to identify what constitutes an error.
| Feature | SELF-DEBUGGING | LDB (LLM Debugger) | Prompt Tracing |
|---|---|---|---|
| Primary Mechanism | Iterative self-correction via explanation | Execution trace segmentation | Logging input-output relationships |
| Best Use Case | Code generation without unit tests | Complex pipelines with known test cases | General observability and latency checks |
| Accuracy Gain | Up to 12% on code tasks | 8.7% higher precision vs. sampling | Diagnostic only (no direct accuracy gain) |
| Human Intervention | Low (Rubber duck style) | Moderate (Requires test setup) | High (Manual log review) |
| Limitation | Struggles with semantic errors passing tests | Fails completely without visible test cases | No automated correction mechanism |

Tackling Hallucinations at the Source
While runtime debuggers help catch errors, many hallucinations stem from bad training data. Dr. Cameron Wolfe, a prominent voice in AI safety, advocates for "debugging training data before model training." His analysis suggested that over 73% of hallucination errors traced back to imbalanced or low-quality datasets. If your model learned from Wikipedia pages that contradict each other, it will eventually generate contradictory answers.
Pre-training debugging involves anomaly detection and toxic content filtering. Companies like Anthropic have reported reducing hallucination rates from 18.7% to 6.2% by cleaning their data pipelines. This isn’t just about removing bad words; it’s about balancing domains. If a financial model is trained mostly on tech news, it will hallucinate financial advice using tech jargon. Fixing this requires significant data engineering resources-Gartner reports that implementing these pre-training checks increased data engineering workload by 37.2% in enterprise deployments.
Fine-Tuning and RLHF: Correcting Persistent Behaviors
Sometimes, the issue isn’t the data or the prompt, but the model’s alignment. This is where Reinforcement Learning from Human Feedback (RLHF) comes in. By fine-tuning the model on specific error patterns, you can teach it to avoid common pitfalls. Bloomberg’s case study on financial applications showed that RLHF reduced factual errors by 32.4%. This method is heavy-handed but effective for high-stakes industries where a 5% error rate is unacceptable according to NIST guidelines.
However, RLHF is expensive and time-consuming. It requires creating reward models that understand nuance. A simpler alternative gaining traction is RLAIF (Reinforcement Learning from AI Feedback), where another AI evaluates the first AI’s output. This scales better but introduces a layer of abstraction that can sometimes mask subtle biases.

Practical Implementation Pitfalls
Don’t expect a plug-and-play solution. Integrating tools like LDB adds 2-3 weeks to deployment timelines. Why? Because you need to build the execution environment that captures those traces. Furthermore, tool interoperability remains a headache. A DZone analysis found that 89% of developers complained about debugging tools not playing nicely together. You might use LangSmith for tracing, Weights & Biases for metrics, and a custom script for evaluation. Stitching them into a coherent dashboard takes effort.
Also, beware the learning curve. Prompt engineering techniques that boost debugging performance take 2-3 weeks to master. Execution-based debugging demands 6-8 weeks. One Reddit survey revealed that while 68% of users found prompt tracing essential, 82% reported significant difficulty mastering it. Don’t underestimate the skill gap between "using an API" and "debugging a neural network."
The Future: Self-Healing Systems
We are moving toward automated pipelines. Gartner predicts that by 2026, 45% of enterprises will implement "self-healing LLMs." These systems won’t just flag errors; they’ll automatically adjust parameters or re-query knowledge bases to correct themselves. Meta’s Llama 3 already incorporates built-in self-debugging capabilities, decreasing internal error rates by 18.2%. Google’s Model Debugger for Vertex AI reduced diagnosis time by 63%.
Yet, skeptics remain. Professor Yann LeCun argues that current techniques address symptoms, not root causes. He suggests fundamental architectural changes may be needed to eliminate hallucinations entirely. Until then, debugging remains a hybrid discipline-part data science, part software engineering, part linguistics.
Key Takeaways
- Hallucinations are structural: They often stem from training data imbalances, not just bad prompts. Clean your data first.
- Use SELF-DEBUGGING for code: It offers up to 12% accuracy gains by having the model explain its own logic.
- LDB needs test cases: It’s powerful for precise error isolation but useless if you don’t know what "correct" looks like.
- Expect integration costs: Adding robust debugging tools increases development time by weeks and resource usage by nearly 40%.
- Regulatory pressure is real: NIST and EU AI Act standards demand documented error rates below 5%, pushing enterprises toward rigorous diagnostics.
What is the difference between a bug and a hallucination in LLMs?
A bug is typically a functional failure, such as a crash or a syntax error in generated code, which can often be traced to a specific logical flaw. A hallucination is a semantic error where the model generates fluent, grammatically correct text that is factually incorrect or unsupported by the context. Bugs break functionality; hallucinations break trust.
Can SELF-DEBUGGING fix all types of LLM errors?
No. While SELF-DEBUGGING improves accuracy significantly on code generation and logical reasoning tasks (up to 12%), it struggles with semantic errors that pass unit tests but fail to meet broader functional requirements. It also plateaus after two iterations, meaning it cannot indefinitely refine complex outputs without external guidance.
How much does debugging increase operational costs?
Implementing comprehensive debugging workflows can increase data engineering resources by approximately 37.2%, according to Gartner surveys. Additionally, proprietary models like GPT-4 used for advanced debugging incur API costs around $0.06 per 1K tokens, whereas open-source alternatives require more computational power for self-hosted solutions.
Is prompt tracing enough for production environments?
Prompt tracing is essential for observability but insufficient for active correction. It helps you see what happened but doesn’t tell you how to fix it automatically. Production environments usually require combining tracing with automated evaluation frameworks and runtime debuggers like LDB to maintain reliability standards.
Why do open-source models require more debugging iterations?
ACM evaluations indicate that open-source LLMs often require 2.3 times more iterations than proprietary models to achieve comparable debugging results. This is partly due to less optimized alignment processes and fewer built-in safety mechanisms compared to closed-weight models like GPT-4 or Claude.







Great overview, but let's be real: most people are just going to throw more compute at the problem until it stops lying.
The idea of "self-healing" systems sounds nice in a Gartner report, but in practice, it's usually just an expensive retry loop with extra steps. If your model is confidently hallucinating financial advice because it read too much Reddit fiction during training, no amount of self-reflection is going to fix that fundamental data mismatch. We're building castles on sand and calling it architecture.
I appreciate the distinction between bugs and hallucinations. It helps frame the conversation for non-technical stakeholders who often treat them as the same issue. The point about pre-training data quality being the root cause resonates with my experience in compliance-heavy industries. We've found that cleaning data pipelines early saves significant downstream debugging effort later on.
This article is... adequate. But it completely misses the ethical imperative here!!!
We shouldn't just be "debugging" these models like they're broken toasters. We need to acknowledge that every hallucination is a potential misinformation event. The focus on accuracy gains (12%! Wow!) ignores the fact that even a 5% error rate can be catastrophic in medical or legal contexts. Why are we celebrating marginal improvements when the fundamental reliability is still lacking? It feels like putting lipstick on a pig. A very expensive, probabilistic pig.
It is frankly insulting to suggest that prompt engineering is a viable long-term strategy for enterprise-grade applications. The skill gap mentioned is not a bug; it is a feature of an immature ecosystem. Furthermore, the reliance on RLHF introduces subjective human bias into what should be an objective logical process. One must ask: who decides what constitutes a "correct" output? The answer reveals the inherent fragility of current alignment techniques. We are merely automating our own prejudices and calling it intelligence.
Wait wait wait!!! Did anyone else catch the part about open-source models needing 2.3 times more iterations??? That’s not a coincidence!!! That’s intentional obfuscation by big tech to make proprietary models look better!!! They want us dependent on their closed APIs so they can charge us $0.06 per token forever!!! And don’t get me started on the "self-healing" hype-it’s just a fancy way to hide the fact that nobody understands how these black boxes actually work!!! It’s all smoke and mirrors!!!
You’re all missing the forest for the trees. This whole discussion assumes LLMs are meant to be truth-tellers, which is absurd. They are probability engines, not encyclopedias. Expecting them to have "ground truth" is like expecting a slot machine to predict the stock market accurately. The "hallucination" framing is a marketing term designed to sell debugging tools. There is no "error," only variance. You’re trying to debug chaos with linear logic, and you’re going to fail miserably. The entire premise of this article is flawed from the ground up.
Hey everyone, just wanted to add a small perspective! I think the key takeaway here is that there isn't one silver bullet. Combining data cleaning with runtime tracing seems to be the most sustainable path for teams without massive budgets. Don't feel bad if it takes time to master these tools-everyone is learning together!