Evaluating Multimodal AI: CLIPScore, FID, and Better Metrics
You built a text-to-image model. It looks great to you. But how do you prove it's actually good? You can't just eyeball a few outputs and call it a day. That’s where multimodal evaluation metrics come in. They are the yardsticks we use to measure quality, alignment, and diversity without hiring an army of human judges for every single test.
The problem is, there is no single number that tells you everything. If you only look at one metric, you will likely fool yourself. A high score on one axis might hide a disaster on another. This guide breaks down the most common tools-CLIPScore and FID-and shows you why you need more than just those two to get the full picture.
Why One Metric Is Never Enough
Imagine you ask an AI to generate "a red car on a blue road." The image looks photorealistic. But wait-the car is green. Or maybe it has three wheels. Or perhaps the road is missing entirely. If you only check if the image "looks real," you miss these errors. If you only check if the text matches, you might miss that the image looks like a blurry mess.
Research backs this up. A 2023 survey of 37 text-to-image papers found that many studies relied solely on automatic measures like FID or described human evaluation poorly. Their pilot experiments showed that existing automatic metrics often disagreed with what humans actually perceived. In short, your model might have a perfect mathematical score but produce images that people hate or find factually wrong.
CLIPScore: Checking Text-Image Alignment
CLIPScore is a reference-free metric introduced by Jack Hessel and colleagues in 2021. It uses the CLIP vision-language model, which was trained by OpenAI on roughly 400 million image-text pairs from the web. The idea is simple: take the embedding (the numerical representation) of your generated image and the embedding of your prompt. Then, calculate the cosine similarity between them. Higher scores mean the image and text are closer together in the model's understanding space.
Why do people love it? It doesn’t need a "correct" answer key. You don’t need a human-written caption for every image. It’s fast and cheap compared to human annotation. For ranking different versions of your model, it works well. If Score A is higher than Score B, Model A generally aligns better with the prompt.
But here is the catch. CLIPScore is a bag-of-words approach. It cares about concepts being present, not their arrangement. It struggles with:
- Counting: It can’t tell the difference between "two dogs" and "one dog" very well.
- Spatial Relations: It often misses whether the cat is on the mat or next to it.
- Negation: Ask for "no cars," and it might still give you a high score if there’s a street scene.
- Fine Details: Text rendering inside the image is usually ignored.
A 2025 study noted that CLIPScore also inherits cultural biases from its training data. It might favor Western-centric aesthetics over others, even if both are valid interpretations.
FID: Measuring Visual Realism
Fréchet Inception Distance (FID) has been around since 2017, originally created for GANs by Martin Heusel and team. Unlike CLIPScore, FID doesn’t care about your text prompt at all. It asks: "Does this batch of generated images look statistically similar to a batch of real photos?"
Here’s how it works under the hood:
- It passes both real and generated images through an Inception-v3 network.
- It extracts feature vectors from these images.
- It assumes these features follow a Gaussian (normal) distribution.
- It calculates the distance between the mean and covariance of the real images versus the generated ones.
Lower FID scores are better. A score of 0 would mean the generated images are indistinguishable from the real dataset in terms of statistical features.
FID is great for spotting mode collapse. If your model keeps generating the same kind of face over and over, FID will rise because the diversity (covariance) drops. However, FID has serious blind spots:
- Prompt Ignorance: You could generate a pile of realistic cats when asked for dogs. FID wouldn’t care, as long as they look like real animals.
- Sensitivity to Preprocessing: Resizing or compressing images can drastically change FID scores, even if humans barely notice the difference.
- Gaussian Assumption: Real-world image features aren’t always perfectly Gaussian, so the math is an approximation.
- Sample Size Bias: FID is unstable with small batches. You need thousands of images to get a reliable number.
Beyond the Basics: Precision, Recall, and KID
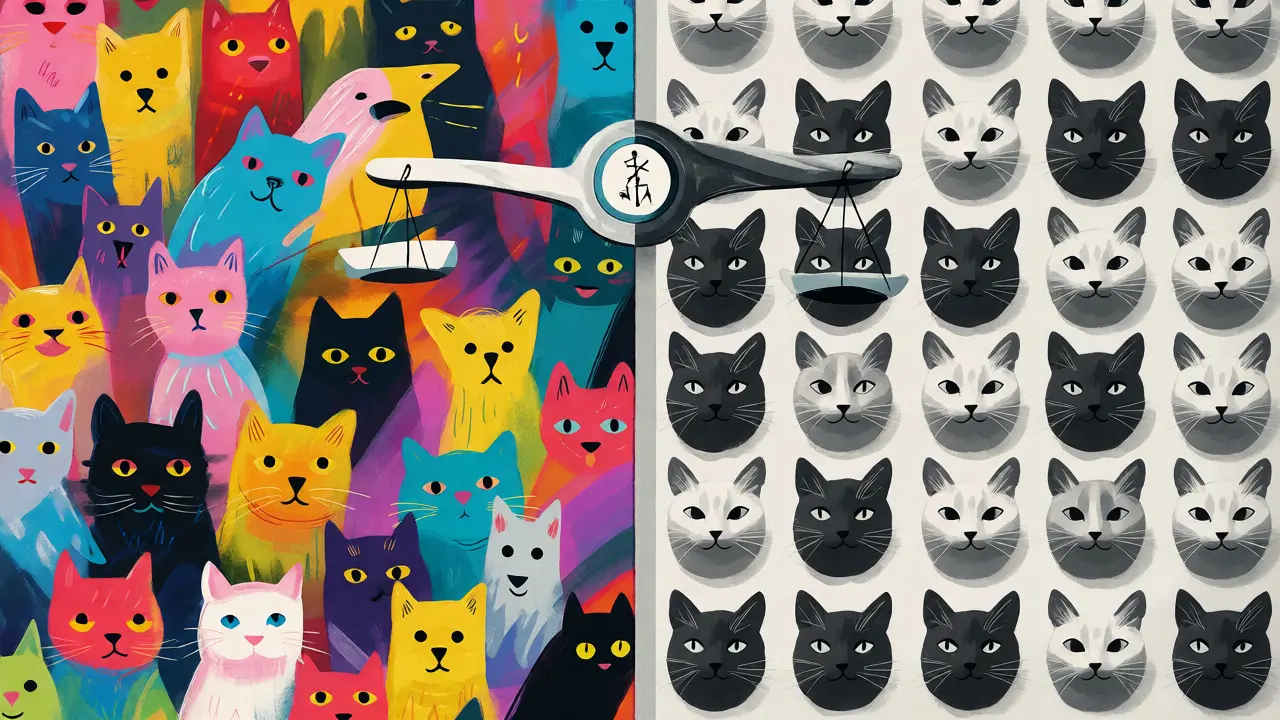
Since FID combines quality and diversity into one confusing number, researchers developed ways to split them apart. Enter Precision and Recall for generative models. Introduced by Kynkäänniemi and colleagues, these metrics separate fidelity from coverage.
- Precision: How many of your generated images are actually realistic? (Quality)
- Recall: How much of the real world’s variety did you capture? (Diversity)
If you have high precision but low recall, your images look great but are repetitive. If you have high recall but low precision, you’re capturing variety but producing garbage. This distinction helps you debug why your model is failing.
Another alternative is Kernel Inception Distance (KID). Proposed by Mikołaj Bińkowski in 2018, KID uses a polynomial kernel instead of assuming Gaussian distributions. This makes it unbiased even with smaller sample sizes. If you are working with limited data, KID is often a safer bet than FID.
Fixing Composition: TIFA and VQAScore
Remember how CLIPScore failed at counting and spatial relations? Newer metrics try to fix this by breaking prompts down into logical questions.
TIFA (Text-to-Image Faithfulness) is a clever approach introduced by Yushi Hu and team at ICCV 2023. Instead of comparing embeddings directly, TIFA uses a large language model to generate a set of yes/no questions from your prompt. For example, for "a red car on a blue road," it might ask: "Is there a car?", "Is the car red?", "Is there a road?", "Is the road blue?"
Then, it uses a visual question answering (VQA) model to check if the generated image answers "yes" to each question. Your final score is the percentage of correctly answered questions. This method is far more interpretable. If your score is low, you can see exactly which attribute failed.
Similarly, VQAScore evaluates whether a VQA model believes the image satisfies the prompt. Recent benchmarks like GenAI-Bench reported that VQAScore aligned better with human ratings than CLIPScore for complex compositional tasks.

The Human Factor
No matter how fancy your metrics get, humans are still the gold standard. Automatic metrics lag behind human preference. A 2024 paper on GenAI-Arena concluded that automatic metrics often have low correlation with what people actually prefer.
When should you use human evaluation?
- Aesthetics: Does it look beautiful or ugly?
- Artifacts: Are there weird hands or melting backgrounds?
- Safety: Is it offensive or biased?
- Utility: Would someone actually use this image?
To make human evaluation rigorous, you need a protocol. Specify who is rating (demographics), how many raters per image, and whether you are doing pairwise comparison (A vs B) or absolute scoring. Pairwise comparisons are generally more reliable because humans are better at choosing between two options than assigning a raw score out of 10.
Building Your Evaluation Dashboard
So, what should you actually use? Don’t pick one. Pick a suite. Here is a recommended setup for evaluating a modern text-to-image model:
| Metric | What It Measures | Best For | Key Limitation |
|---|---|---|---|
| CLIPScore | Text-Image Semantic Alignment | Quick ranking, checking basic topic match | Ignores composition, counts, and spatial layout |
| FID / KID | Visual Realism & Distributional Quality | Checking if images look like real photos | Ignores the text prompt entirely |
| TIFA / VQAScore | Compositional Correctness | Verifying specific attributes, counts, and relations | Depends on the accuracy of the underlying VQA model |
| Precision/Recall | Fidelity vs. Diversity | Diagnosing mode collapse or lack of realism | Requires careful threshold tuning |
| Human Eval | Preference, Aesthetics, Safety | Final validation and user experience | Expensive, slow, and subjective |
For a defensible experiment, freeze your variables. Use the same prompt suite, the same random seeds, and the same preprocessing pipeline for every model you compare. Report confidence intervals, not just averages. And never delete failed generations silently-they count toward your failure rate.
Frequently Asked Questions
Can I rely solely on CLIPScore for my project?
No. CLIPScore is excellent for ensuring the image relates to the text, but it fails at verifying details like object counts, colors, and spatial relationships. Always pair it with a compositional metric like TIFA or a human review.
Why does my FID score change when I resize images?
FID relies on feature extraction from networks like Inception-v3, which are sensitive to input resolution and compression artifacts. Even minor resizing can alter the statistical distribution of features, leading to significant FID shifts despite little perceptual difference.
Is KID better than FID?
KID is generally more stable for smaller sample sizes because it doesn't assume a Gaussian distribution. However, FID remains the industry standard for large-scale comparisons. If you have fewer than 10,000 samples, consider using KID.
How many images do I need for a valid FID calculation?
Statistical stability typically requires at least 10,000 to 50,000 generated images. With fewer samples, the variance in the estimate becomes too high to draw meaningful conclusions.
What is the main advantage of TIFA over CLIPScore?
TIFA breaks down the prompt into verifiable questions, allowing it to detect specific errors like incorrect object counts or wrong colors. CLIPScore treats the prompt as a whole semantic blob, missing these fine-grained details.