
Metrics Dashboards for Vibe Coding: Risk & Performance Guide
You ask the AI to tweak a chart label. It changes the data source. You fix the data source. The dropdown menu vanishes. This is the reality of vibe coding without proper oversight. As conversational AI turns natural language prompts into functional applications, speed has exploded, but so have the risks. A metrics dashboard for vibe coding isn't just about looking at pretty charts; it's a safety net that tells you when your "improvisational dialogue with data" is drifting off course.
The core problem is simple: traditional BI tools were built for static code, not dynamic AI generation. When you use platforms like ChatGPT Code Interpreter or specialized tools to build apps via prompts, the output can change in unpredictable ways. You need a system that tracks both how fast these tools work and how stable they are. This guide breaks down exactly what to monitor, why it matters, and how to set up a dashboard that actually protects your business.
Why Traditional Dashboards Fail Vibe Coding
Most existing analytics setups assume that once a report is built, it stays the same unless a developer manually updates the code. In vibe coding, the "code" is regenerated constantly based on context. Legacy Business Intelligence (BI) platforms often layer prompts onto outdated architectures, resulting in static views that can't keep up with the dynamic nature of AI outputs. If your current dashboard only shows historical sales data but doesn't track how that data was retrieved by the AI, you're flying blind.
The key difference lies in traceability. Standard dashboards show the result. Vibe coding dashboards must show the process. They need to capture the prompt history, the specific model version used, and any intermediate steps where the AI might have "hallucinated" a connection or ignored a constraint. Without this visibility, a minor prompt adjustment today could break a critical workflow next week, and you won't know until a user complains.
Core Metrics: What Actually Matters
Not all metrics are created equal. Dr. Elena Rodriguez from the MIT Data Science Lab warns against "vanity metrics" that look good but hide underlying instability. Instead, focus on fundamental indicators that scream when something is wrong. Here are the three pillars of effective vibe coding monitoring:
- Stability Scoring: This measures how frequently minor prompt changes trigger unintended functionality alterations. Industry benchmarks suggest an instability rate below 5% for production environments. If your score is higher, your AI is too volatile for critical tasks.
- Generation Latency: Track the time from prompt submission to rendered output. As of Q3 2024, standard queries average around 850ms. If this spikes significantly, it indicates backend bottlenecks or overly complex logic chains that need simplification.
- Fidelity Drift: Use vector similarity scoring to detect when generated code drifts from intended functionality. A cosine similarity threshold of 0.85 is typically required to maintain acceptable fidelity. Below this, the AI is likely inventing new behaviors rather than following instructions.
These metrics don't exist in isolation. Stability affects latency (complex retries slow things down), and fidelity errors often manifest as stability issues. Your dashboard should correlate these signals to give you a holistic view of health.
Building the Monitoring Architecture
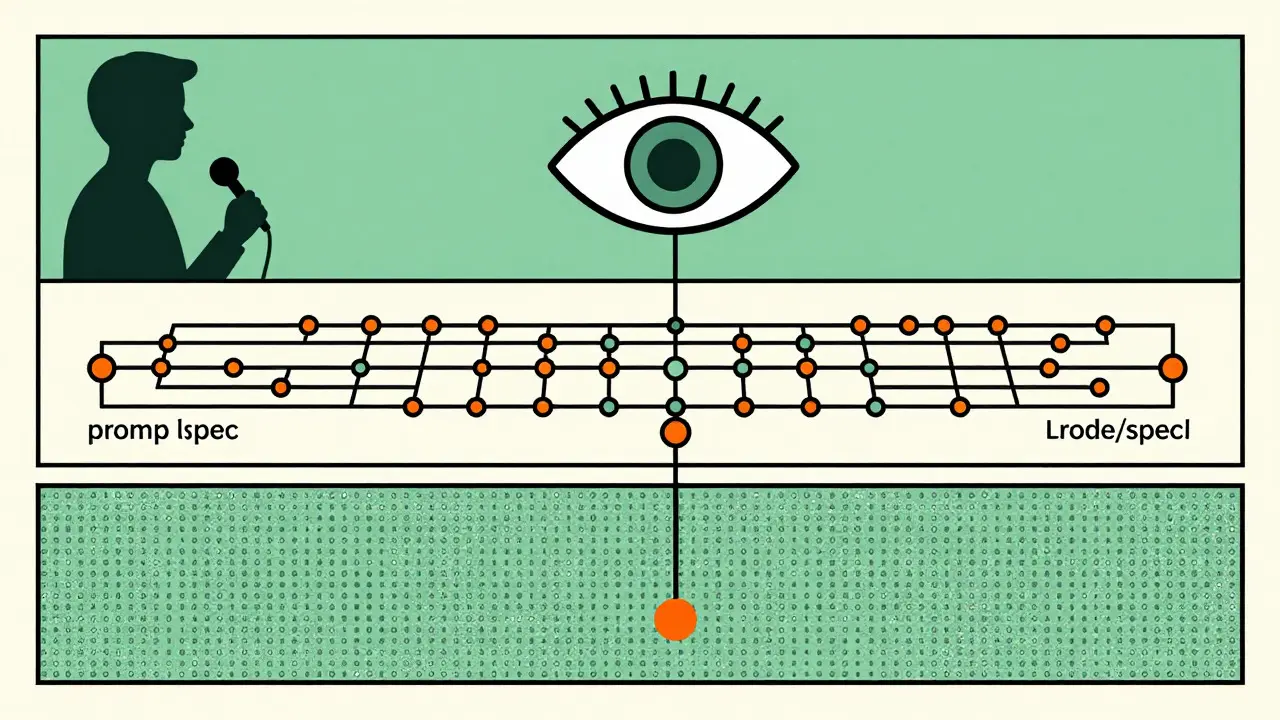
Effective monitoring requires a multi-layered approach. Think of it as three distinct layers of visibility, each serving a different purpose:
- Compressed Prompts Layer: Logs the high-level intent of the user. Did they ask for a "sales summary" or a "detailed regional breakdown"? This helps identify if the user's expectation mismatched the AI's interpretation.
- Semi-Structured Spec Layer: Captures the intermediate logic the AI decided to use. Which tables did it join? What filters did it apply? This is where you catch logic errors before they hit the final output.
- Full Fidelity Code Output Layer: Records the exact executable code or query generated. This is your audit trail. If something breaks, this is where you find out exactly what went wrong.
Implementing this architecture allows you to pinpoint exactly where the failure occurred. Was it a misunderstanding of the prompt? A bad choice of data source? Or a bug in the generated code? Knowing the answer saves hours of debugging.
Platform Comparison: Specialized vs. General Tools
Choosing the right tool depends on your scale and risk tolerance. General analytics tools are adding vibe capabilities, but specialized platforms offer deeper risk controls. Here’s how they stack up:
| Feature | Plotly Studio | Powerdrill | Custom API Builds |
|---|---|---|---|
| Primary Strength | Detailed logging & traceability | Context-aware follow-ups | Full customization & control |
| Risk Monitoring Depth | High (3-layer architecture) | Medium (Focus on continuity) | Variable (Depends on implementation) |
| Pricing Model (Per User/Month) | $149 (Enterprise) | $29 (Standard) | Development Costs + Infrastructure |
| Best For | Regulated industries, high-stakes apps | Marketing/Analytics teams, rapid prototyping | Large enterprises with dedicated DevOps |
| Key Limitation | Cost complexity | Limited deep-code inspection | Requires significant technical skill |
Specialized platforms like Plotly Studio excel at providing the "logging systems" needed to bring insight into the core workflow. They track how the app changed, what spec was used, and what the model generated. On the other hand, tools like Powerdrill focus on maintaining conversation history to prevent metric drift, which is great for iterative analysis but less robust for strict compliance needs. Custom builds using APIs from providers like Priority offer the most control, allowing you to define exact refresh cadences and security scopes, but they require significant upfront engineering effort.

Security and Governance Essentials
Vibe coding doesn't happen in a vacuum. It touches your data, your users, and your brand. Therefore, security metrics are non-negotiable. According to IDC Analytics, 83% of enterprise implementations adopted role-based access control (RBAC), API scoping, and audit trails as baseline requirements by Q3 2024. If you aren't tracking who accessed what data through which AI prompt, you have a compliance gap.
GDPR compliance is a major driver here. The EU Data Protection Board guidance now requires specific audit capabilities for any application handling personal data, including those generated by AI. Your dashboard must be able to answer: "Which user prompted this report? What data did it touch? When was it last verified?" Without this, a single leaked prompt could expose sensitive PII without anyone knowing until it's too late.
Additionally, watch out for "hidden rewrites." This occurs when the AI subtly changes the underlying logic to accommodate a new request, breaking previous assumptions. To mitigate this, implement version control for your prompts and outputs. Studies show that platforms without explicit version tracking experience 37% more production incidents. Treat your prompts like code: commit them, review changes, and roll back when necessary.
Implementation Strategy: From Pilot to Scale
Don't roll out vibe coding dashboards company-wide on day one. Start with a pilot group in marketing or analytics departments, where the cost of error is lower and the feedback loop is faster. Define your decision KPIs clearly before you start. What does "success" look like? Is it faster report generation? Higher accuracy? Lower IT dependency?
Once the pilot proves stable, expand gradually. Train your business analysts to read the dashboard. They need to understand what a spike in instability means and how to act on it. Most analysts require 3-5 days of training to effectively monitor these outputs. Provide them with clear guidelines: if fidelity drops below 0.85, pause the deployment. If latency exceeds 1 second, investigate the query complexity.
Finally, establish a hybrid monitoring approach. Automated metrics catch the obvious issues, but human oversight is still required for edge cases. Schedule regular review cycles where data engineers examine the "full fidelity code output" layer for any suspicious patterns. This combination of automated alerts and expert review is the gold standard for managing vibe coding risk.
What is the ideal instability rate for vibe coding in production?
Industry benchmarks target an instability rate of less than 5%. This means that fewer than 5% of minor prompt changes should result in unintended functionality alterations. If your rate is higher, your AI model or prompting strategy needs refinement before scaling.
How do I measure 'fidelity drift' in my AI-generated code?
Fidelity drift is measured using vector similarity scoring. You compare the semantic meaning of the generated code against the intended specification. A cosine similarity score of 0.85 or higher is generally considered acceptable. Scores below this indicate the AI is deviating from the original intent.
Is vibe coding safe for regulated industries like finance or healthcare?
Yes, but only with rigorous governance. You need full audit trails, role-based access control, and version control for prompts. Specialized platforms with detailed logging capabilities are recommended over general-purpose tools. Ensure your setup meets GDPR or HIPAA requirements by tracking every data access event triggered by an AI prompt.
What is the difference between a standard BI dashboard and a vibe coding dashboard?
A standard BI dashboard displays static results from pre-defined queries. A vibe coding dashboard monitors the dynamic process of AI generation. It tracks prompt history, model versions, generation latency, and stability scores. The goal is not just to show data, but to ensure the AI is retrieving and presenting that data correctly and consistently.
How much does it cost to implement a vibe coding monitoring system?
Costs vary by platform. Basic monitoring starts around $29 per user per month for standard tiers. Enterprise solutions with full audit trails and anomaly detection can cost up to $149 per user per month. Custom API implementations may have lower software costs but require significant development and infrastructure investment.