Observability for Vibe-Coded Systems: Logging, Metrics, and Tracing Basics
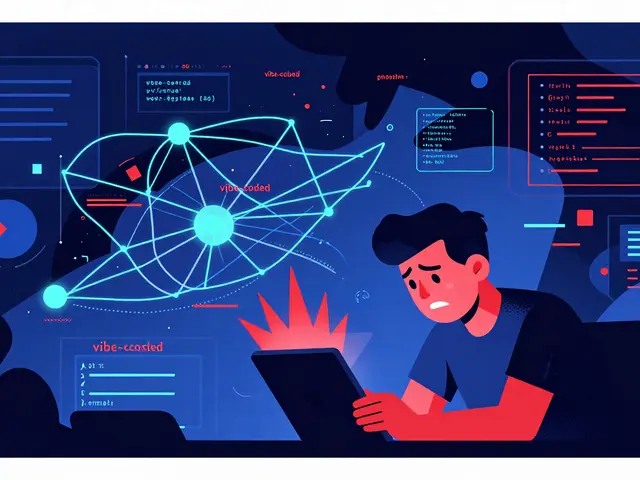
You just shipped a feature. The AI wrote the code, the tests passed, and you hit deploy. Ten minutes later, your error rate spikes by 40%. You open the logs, but it’s just a wall of console.log text with no context. You can’t tell if the issue is in the database, the API call, or the new logic the model invented on its own. This is the reality of "vibe coding"-a workflow where you prompt AI models to generate large chunks of code autonomously. Because you aren't reading every single line before it goes live, traditional code review isn't enough. You need a safety net that works in real-time. That net is observability.
In vibe-coded systems, observability isn't just about monitoring uptime; it's about understanding *why* the system behaves the way it does when the AI makes a subtle mistake. It replaces the human eye checking code with data signals that reveal bottlenecks, leaks, and failures instantly. If you're building with AI assistance, you need to treat telemetry as a first-class citizen, not an afterthought.
The Core Problem: Why Traditional QA Fails with AI Code
When a human writes code, they usually have a mental model of how it should work. They know which lines are critical and where things might break. When an AI writes code, it optimizes for pattern matching against training data. It might write efficient-looking code that has hidden performance traps, like N+1 query problems, that only show up under load. Since developers often trust the AI's output without deep manual review, these issues slip through.
Observability solves this by providing three distinct types of signals. Each one answers a different question:
- Distributed Tracing: Answers "Where exactly did this request slow down?" It maps the full lifecycle of a request, showing which specific database call or external API took too long.
- Structured Logging: Answers "What was the state of the system when this error happened?" It captures context like user IDs and error types, allowing you to diagnose issues without reproducing them locally.
- Real-Time Metrics: Answers "Is the system behaving normally right now?" It establishes baselines for memory usage and response times, alerting you to anomalies before they become outages.
Without these three working together, you’re flying blind. A log tells you something broke, but not why. A metric tells you something is wrong, but not where. A trace shows you where, but without metrics, you don't know if it's a new problem or just normal variance.
OpenTelemetry: The Universal Language for Telemetry
To implement this effectively, you need a standard. OpenTelemetry is the vendor-neutral open standard for collecting and exporting telemetry data including traces, metrics, and logs. It acts as a universal translator between your application code and your observability backend.
Why does this matter for vibe coding? Because AI tools are increasingly generating code that includes OpenTelemetry instrumentation automatically. If you use proprietary SDKs from specific vendors, you risk lock-in. But with OpenTelemetry, you can switch backends-whether that's an open-source stack or a commercial platform-without rewriting your instrumentation code. This flexibility is crucial when you're iterating quickly with AI-generated features.
OpenTelemetry provides standardized libraries for common frameworks. For example, if your AI generates Express.js middleware or uses Prisma for database operations, OpenTelemetry can automatically capture HTTP request durations, database query timings, and authentication events. You don't need to manually add timing wrappers around every function. The standard handles the heavy lifting, ensuring that your AI-generated code is instrumented correctly from the start.
Choosing Your Backend: VictoriaMetrics vs. Commercial Platforms
Once you've collected telemetry via OpenTelemetry, you need somewhere to store and visualize it. Two main approaches dominate the market: unified open-source stacks and commercial all-in-one platforms.
| Feature | VictoriaMetrics Stack | Commercial Platforms (e.g., Dynatrace) |
|---|---|---|
| Components | VictoriaMetrics (metrics), VictoriaLogs (logs), VictoriaTraces (traces) | Integrated suite with auto-discovery and APM |
| Cost Structure | Lower infrastructure costs, self-managed or managed cloud options | Higher subscription fees, often based on host count or data volume |
| Setup Complexity | Requires configuring separate services for each signal type | Single agent installation, automated setup |
| Best For | Teams wanting control, cost efficiency, and OpenTelemetry native support | Enterprises needing out-of-the-box analytics and vendor support |
The VictoriaMetrics Stack is a high-performance, open-source observability solution consisting of VictoriaMetrics, VictoriaLogs, and VictoriaTraces. It’s particularly popular for vibe-coded systems because it’s lightweight and fast. VictoriaMetrics handles time-series data efficiently, meaning you can keep detailed metrics for longer periods without blowing up your storage bills. VictoriaLogs provides a powerful query language for searching through massive log volumes, while VictoriaTraces lets you visualize the complete flow of a request across microservices.
On the other hand, commercial platforms like Dynatrace offer a more "hands-off" experience. They often include advanced anomaly detection and root cause analysis built-in. However, for many indie developers and startups using AI to ship features rapidly, the cost of these enterprise solutions can be prohibitive. The VictoriaMetrics approach allows you to build a robust observability layer that scales with your project without the hefty monthly fee.
Strategic Implementation: Don't Log Everything
A common mistake in vibe coding is telling the AI to "add comprehensive logging everywhere." This leads to log noise. Instead, focus on strategic observability for critical paths and error conditions.
Here’s how to structure your observability requirements when prompting your AI:
- Define Structured Logs: Instruct the AI to use JSON-formatted logs with specific fields:
user_id,request_id,error_type, andseverity. Avoid plain text strings. Structured logs allow you to filter for "all errors where user_id = 123" in seconds. - Instrument Key Operations: Ensure that database queries, external API calls, and authentication steps are traced. These are the most likely places for AI-generated code to introduce latency or failures.
- Set Up Baseline Metrics: Track request duration histograms, error rates, and memory usage. Set alerts for deviations from the baseline, not just absolute thresholds.
Always test your observability in development mode first. Trigger an error intentionally and check if the logs contain the right context. Verify that the trace shows the correct sequence of events. If the chain breaks in dev, it will definitely break in production when you actually need it.
The Closed Loop: Feeding Data Back to the AI
This is where vibe coding gets really interesting. Modern AI models can process visual data. This means you can take screenshots of your dashboards, traces, or log entries and feed them back into the AI chat window. Instead of describing a bug in words, you show the AI the trace that highlights the slow database query. The model can then analyze the visual evidence and suggest a fix directly.
This creates a self-improving loop. The observability data doesn't just help humans debug; it helps the AI understand the system better. Over time, as you iterate, the AI learns what "good





Really appreciate the focus on structured logging here. It’s a small change in prompting but makes debugging so much less painful later.
You’re absolutely right, and frankly it’s a bit shocking how many devs still ignore this! I mean, really? Who ships without tracing these days?! It’s just... lazy, honestly. You have to be disciplined about your telemetry setup, or you’re just gambling with production stability. And don’t even get me started on the cost of fixing things after they break; that’s where the real money goes, not in the monitoring tools themselves. So yes, keep pushing this message out there, because clearly some people need the nudge!
Good point about testing observability in dev mode first. We did that last sprint and caught a broken trace chain before it hit prod. Saved us hours.
The premise is flawed. Vibe coding is a temporary phase, not a permanent architecture strategy. Relying on AI to write code without deep review is a recipe for disaster regardless of your observability stack. The real issue is trust, not telemetry. If you can't read the code, you shouldn't be shipping it. Period. Stop looking for silver bullets in monitoring dashboards when the root cause is a lack of engineering rigor. The market will correct this inefficiency quickly. Just wait.
Wait until they tell you OpenTelemetry is actually tracking your soul data back to Big Tech!! They are hiding it in the metadata!!! Have you seen the new privacy clauses?? It’s all connected!!!
Let's be real for a second: VictoriaMetrics is only 'lightweight' if you enjoy spending your weekends configuring YAML files while drinking cold coffee. The 'cost efficiency' argument is a myth for anyone who values their time over saving $50 a month. Commercial platforms aren't just selling software; they're selling sanity. If you think self-managing three separate services is easier than installing one agent, you haven't actually done it. The 'control' you gain is mostly just more headaches. Don't believe the hype about open-source being free; it costs you sleep. That's the hidden price tag no one mentions in these optimistic blog posts.