
How to Prompt for Performance Profiling and Optimization Plans
Most developers think performance issues are solved by guessing. They tweak this setting, move that function, or swap libraries hoping for a speed boost. But without solid data, you’re just spinning wheels. The real key isn’t working harder-it’s knowing exactly where the problem lives. That’s where performance profiling comes in. It’s not magic. It’s measurement. And if you know how to ask the right questions, you’ll get answers that actually move the needle.
Start with the Right Question
You can’t optimize what you don’t measure. But not all profiling prompts are created equal. Saying “Why is my app slow?” gets you nowhere. It’s too vague. Instead, frame your question around specific behavior. Ask: “Which function is consuming the most CPU time during scene loading?” or “Where are the biggest memory allocations happening during player input?” These questions force the profiler to focus on concrete events, not general feelings. Think of it like going to the doctor. You don’t say, “I feel bad.” You say, “My knee hurts when I climb stairs.” That’s actionable. The same goes for code. Define the trigger, the environment, and the symptom.Set Up Your Baseline First
Before you even run a profiler, you need a baseline. What does “normal” look like? If you don’t know, you won’t recognize improvement. For mobile games, that means testing on the lowest-spec device you plan to support-like a Snapdragon 665. For web apps, it’s a slow 4G connection and an older browser. For backend services, it’s a low-CPU VM with minimal RAM. Run your app under those conditions. Record metrics: frame time, memory usage, render calls, GC pauses. Save this as your “before” snapshot. Now, when you make a change, you’re comparing against reality, not wishful thinking. Unity developers do this well. They define hardware tiers: minimum, mid, and high-end. That way, optimizations aren’t just “faster”-they’re targeted. One indie dev increased FPS on low-end devices from 28.4 to 56.7 by optimizing only for the Snapdragon 665, not the latest flagships. That’s the power of a clear baseline.Use the Right Tool for the Job
Not all profilers are the same. And picking the wrong one gives you garbage data. - Sampling profilers (like Intel VTune or Linux perf) take quick snapshots of what’s running. They add almost no overhead-under 1%-so your app runs nearly normally. Great for finding heavy hitters. But they can miss very short functions or misattribute time if interrupts line up badly. - Instrumenting profilers (like Unity Profiler or Visual Studio Diagnostic Tools) inject timing code into every function. They give precise numbers, down to nanoseconds. But they slow things down by 5-15%, and they can distort how the CPU caches or predicts branches. If a function runs a million times a second, the profiler itself might be the bottleneck. The trick? Use both. Start with sampling to find the big offenders. Then switch to instrumentation to zoom in on the top 3 candidates. Don’t trust one tool alone. Cross-check.Look for the 85% Problem
In most apps, 85% of the slowdown comes from just 5% of the code. That’s the 80/20 rule, but even more extreme. Your job isn’t to fix everything. It’s to find the one thing that’s dragging everything down. Trimble Maps found this in their geolocation engine. One function, processing “Genre: Comedy” data, took 17.8 seconds. Another, “Genre: Children,” took 1.7 seconds. Same code. Same inputs. Just different data. The fix? A simple cache. That one change cut 16 seconds off the total runtime. No rewriting. No architecture changes. Just a smarter lookup. Profiling tools will show you a list of functions ranked by time. Ignore the ones at the bottom. Focus on the top 2 or 3. Ask: “Is this function called too often? Is it doing work it shouldn’t? Is it waiting for something?”Watch Out for Measurement Distortion
This is where most people fail. They see a function taking 12% of CPU time and assume it’s the problem. But if that function is called 2 million times per second, and each call takes 50 nanoseconds, optimizing it won’t matter. The real issue might be a memory allocation that happens once every 10 seconds-but it triggers a 300ms GC pause. Instrumenting profilers can make short functions look worse than they are. Sampling profilers can make fast, frequent functions look like monsters. Always ask: “Is this measurement real, or is it an artifact?” Intel’s VTune 2024 has a feature called “Distortion Analysis” that tells you exactly how much your profiling is messing with the results. If you’re using an older tool, run two tests: one with profiling, one without. Compare the total runtime. If the difference is more than 10%, your data is skewed.Turn Off Debug Flags
This is the easiest win you’ll ever get. If you’re profiling in Debug or Development mode, you’re wasting your time. Unreal Engine’s internal tests show debug builds add 18-25% overhead just fromcheck() and ensure() calls. Harvard’s research found removing debug flags gave 22-37% speed gains across 87% of scientific apps.
Switch to Release or Master mode. Disable asserts. Turn off debug logging. Even if you think you’re being careful, those extra checks are slowing you down. You’re not testing performance-you’re testing how slow your app is when burdened with safety nets.
Optimize for the Right Hardware
A function that runs fine on an M3 MacBook might choke on a 5-year-old Android phone. You can’t optimize for all devices at once. That’s why Unity recommends defining hardware tiers. Set up three test devices: low, medium, high. Profile each one separately. Don’t assume what’s slow on one is slow on all. You might find that texture compression is the issue on low-end, but shader complexity is the killer on mid-range. That’s two different fixes. ARM’s 2023 analysis shows mobile games need 2.3x more processing power every year. If you’re not testing on current low-end hardware, you’re already behind.Use AI to Guide, Not Replace
NVIDIA’s new CUDA Graph Analyzer uses machine learning to predict optimization opportunities. In beta tests, it improved accuracy by 37% over traditional profiling. That’s huge. But it doesn’t replace your judgment-it enhances it. Think of AI-assisted tools like a co-pilot. It points out patterns you might miss: “This kernel has high memory divergence,” or “This loop could be vectorized.” But you still need to understand why. Don’t blindly apply suggestions. Test them. Measure them. Confirm.Make Optimization a Habit, Not a Panic
The best teams don’t wait until launch week to profile. They do it daily. Epic Games found that projects starting profiling in the first three months of development ended up 40% faster at launch than those who waited until alpha. Build profiling into your workflow. Run a quick CPU profile after every major feature commit. Add a performance test to your CI pipeline. Make it part of the definition of “done.” You don’t need to be an expert. You just need to be consistent. Even 10 minutes a day of profiling will catch 90% of the big problems before they become disasters.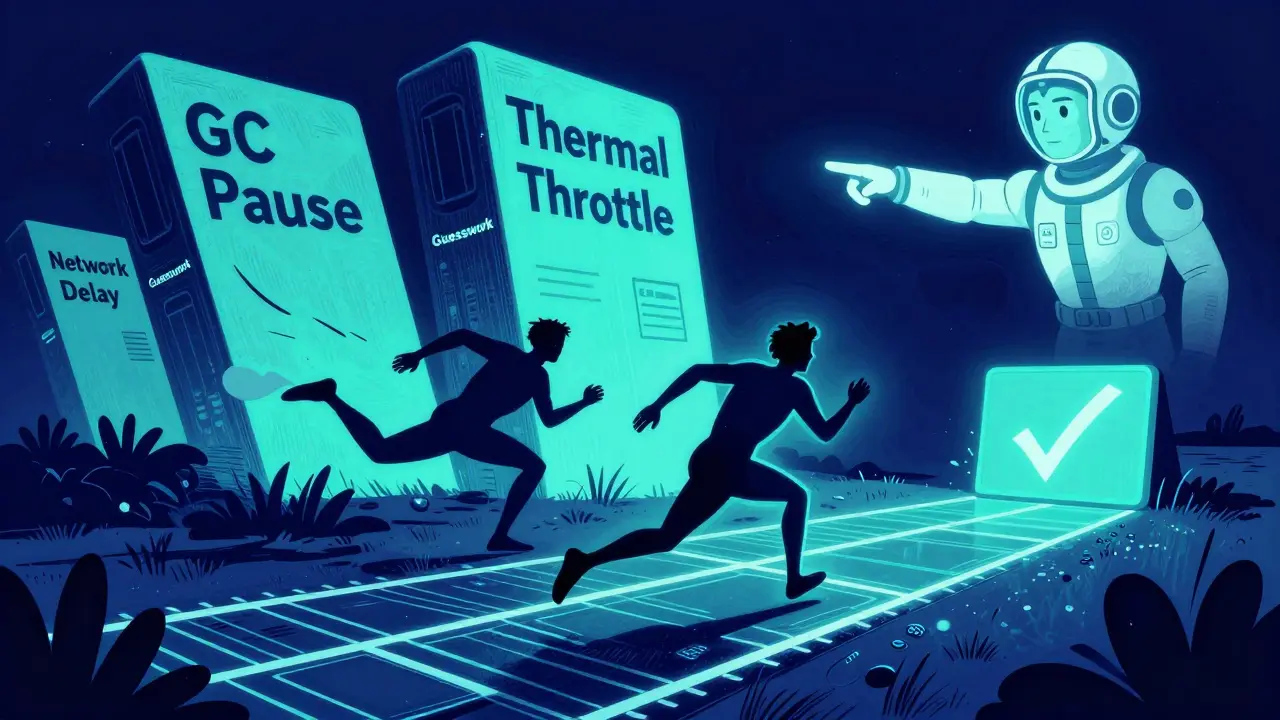
Verify Every Change
Optimizing without verification is like taking medicine without checking if it worked. You think you fixed it. But did you? After every change, re-run your baseline test. Compare the numbers. Did frame time drop? Did GC pauses shrink? Did memory usage improve? If not, you didn’t fix anything-you just changed something. Unity’s 5-step process works because it forces verification:- Establish hardware tiers
- Create baseline metrics
- Do high-level profiling
- Find top offenders
- Optimize and verify
What to Do When Nothing Seems Slow
Sometimes, the app feels sluggish, but the profiler shows everything under 5%. That’s not a profiling failure. It’s a perception problem. Check for:- Frame pacing issues (jank)-a profiler might show 60 FPS, but if frames are unevenly spaced, it feels choppy
- Input lag-delay between user action and visual response
- Thermal throttling-your device is slowing down because it’s overheating
- Network delays-your app is waiting for data, but the profiler only sees local code
Final Checklist
Before you call your optimization complete, run through this:- Did I profile on the lowest-spec device I support?
- Did I turn off debug flags and use Release mode?
- Did I use both sampling and instrumentation profilers?
- Did I focus on the top 3 functions consuming the most time?
- Did I measure before and after?
- Did I verify the change didn’t break anything else?
What’s the difference between sampling and instrumenting profilers?
Sampling profilers take quick snapshots of what’s running, adding less than 1% overhead. They’re great for finding heavy functions but can miss short ones or misattribute time. Instrumenting profilers add timing code to every function, giving precise measurements but slowing the app by 5-15%. Use sampling first to find suspects, then instrument to zoom in.
Why does my app feel slow even when the profiler shows low CPU usage?
CPU usage isn’t everything. Look for frame pacing issues, input lag, thermal throttling, or network delays. A profiler might show 60 FPS, but if frames arrive unevenly, the app feels choppy. Use tools like Unity’s Frame Timing API or Chrome’s Performance tab to check timing consistency.
Can I trust the numbers from my profiler?
Not always. Instrumenting profilers can distort how the CPU runs code, especially for very fast functions. Sampling profilers can misattribute time if interrupts line up poorly. Always run two tests: one with profiling, one without. If total runtime changes by more than 10%, your data is likely skewed.
Should I optimize for the latest hardware or the oldest?
Optimize for your lowest-spec target. If your app runs well on a Snapdragon 665, it’ll run great on newer devices. Trying to optimize for the latest hardware means you’ll miss the real bottlenecks that affect your actual users.
Is AI-powered profiling worth using?
Yes, but as a guide, not a replacement. Tools like NVIDIA’s CUDA Graph Analyzer can spot patterns you might miss, like memory divergence or vectorization opportunities. But you still need to test and verify each suggestion. AI helps you ask better questions-it doesn’t answer them for you.
Next Steps
Start small. Pick one feature in your app that feels slow. Set up a baseline on your lowest-spec device. Run a sampling profiler. Find the top function. Turn off debug flags. Make one change. Measure again. If it got faster, you just did real optimization. If not, you learned something. Either way, you’re ahead of 90% of developers who never profile at all.


Let me guess-you think saying ‘use a baseline’ is original advice? Every damn blog since 2015 has said this. You didn’t invent profiling. You just packaged it in bullet points like a TED Talk for junior devs who think ‘optimization’ means turning off Unity’s debug logs and calling it a day.
This is actually one of the clearest guides I’ve read on profiling. The doctor analogy? Perfect. I’ve seen so many teams waste weeks chasing ghosts because they didn’t establish a baseline. Thanks for framing it so plainly. 🙏
Great breakdown! Seriously, though-turning off debug flags? That’s the #1 thing I see teams forget. And yes, sampling + instrumentation together? Non-negotiable. Don’t trust a single tool. Cross-check. Always. And yes, the 85% rule is real-focus on the top 2-3 functions, not the whole list. You’ll thank yourself later.
Simple and powerful. I’ve seen this work in India with low-end phones-optimize for the weakest device, and everyone else benefits. No magic, just discipline. Thanks for the clarity.
Wow. A 2000-word essay on ‘don’t guess’. Did you write this in 2012 and just now hit publish?
I love how you said to just pick one slow thing and try fixing it. I’ve been scared to touch performance stuff but this feels doable. I’ll try it tomorrow.
Agreed with Alan. The baseline point is gold. I used to profile on my i9 Macbook and wonder why the Android build was a slideshow. Now I test on a $150 Moto G. Game changer.
Let’s be real-profiling isn’t just about tools or baselines or even the 80/20 rule. It’s about cultivating a mindset of empirical rigor in an industry that’s still dominated by tribal knowledge and cargo-cult optimization. You can’t optimize what you don’t measure, and you can’t measure what you don’t instrument, and you can’t instrument what you don’t instrument properly, and if your instrumentation introduces distortion, then your entire optimization strategy is built on sand. The fact that most teams still use debug builds for profiling is not just negligent-it’s a systemic failure of engineering culture. And yes, AI can help, but only if you understand the underlying data structures, memory hierarchies, and branch prediction behaviors that make those suggestions meaningful. Otherwise, you’re just letting a neural net do your thinking for you, and that’s how you end up with a 200ms GC pause because you vectorized a loop that should’ve been cached.
Lucia, you just described the exact reason why I hate performance engineering. Everyone turns it into a philosophy seminar. I just want to know which function is eating my frame budget. No metaphors. No ‘engineering culture.’ Just tell me where the bottleneck is. And yes, I’ve seen teams spend three weeks arguing about sampling vs instrumentation while the real issue was a texture streaming bug that only showed up on Qualcomm Adreno 610. Fix the damn thing. Then write the essay.